My study group logs progress in Notion. I wanted a lightweight dashboard so everyone could see weekly study hours—some for motivation, others for encouragement.
Architecture Overview
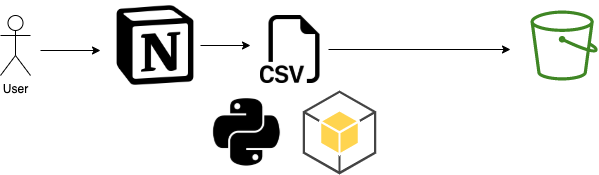
- Teammates record sessions in Notion.
- Export the Notion database as CSV.
- Use Python + Matplotlib to visualize the data.
- Upload the chart to Amazon S3 via Boto3.
- Share the S3 object URL as our dashboard.
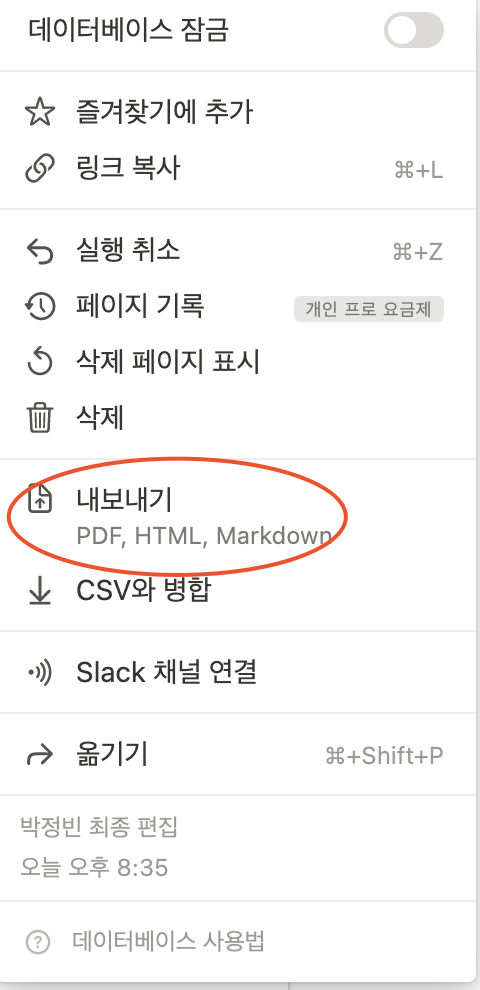
Exporting from Notion
Open the database, click the menu in the top-right corner, and choose Export. (I’m still hoping Notion exposes CSV exports via API so this can be fully automated with Airflow.)
Visualization with Matplotlib
I generated a simple line chart summarizing each person’s study hours over the past week:
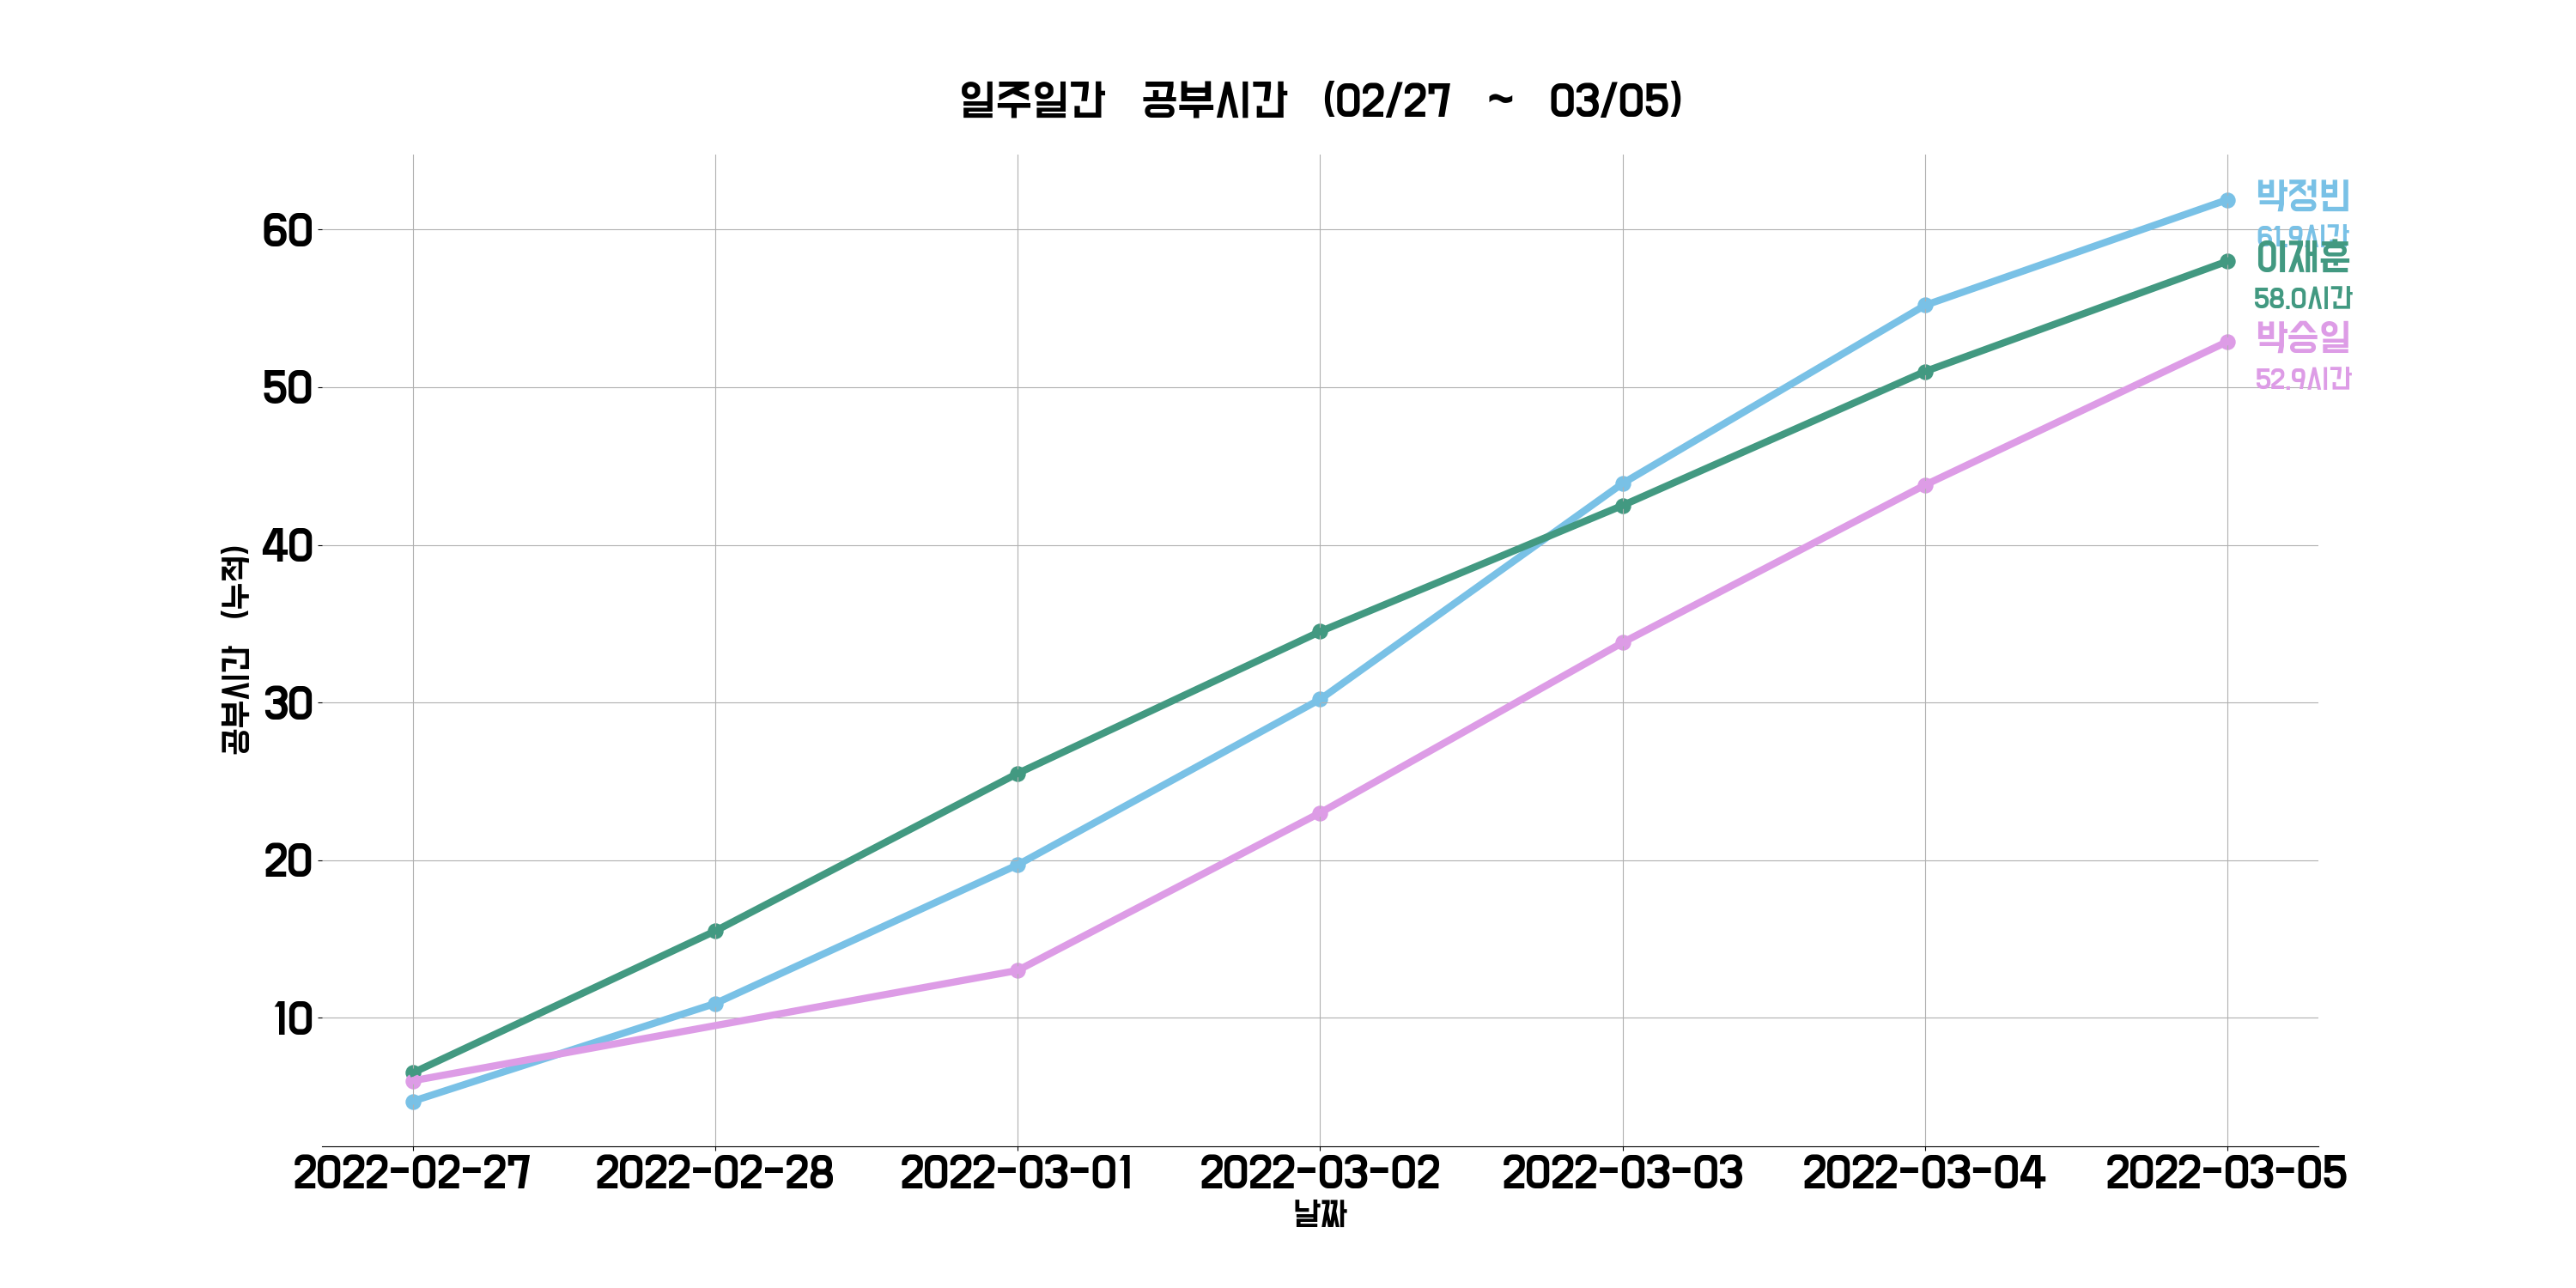
Seeing everyone’s totals at a glance helps us celebrate wins—or nudge slackers.
Sample code lives on GitHub: make_plot.py
Uploading with Boto3
Once the chart is created, upload it to S3. See my earlier post, Getting Started with Boto3, for secure credential handling. Code reference: the same GitHub repo.
Prepare a simple index.html that embeds the chart—also in the repo.
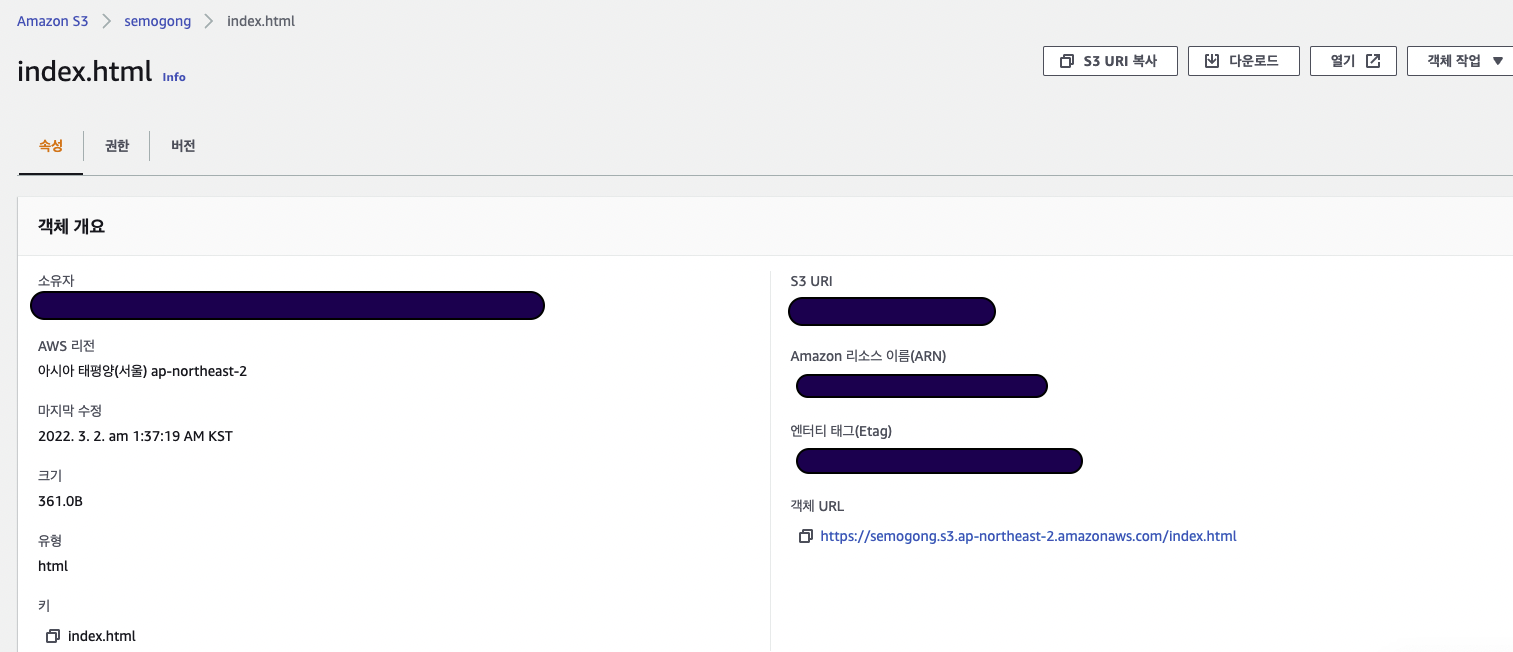
Serve via S3
Every uploaded object has a public URL (assuming the ACL permits it). Share that link so teammates can access the dashboard:
Bonus: One-Click Refresh with Bash
I initially planned to automate the entire flow with Notion’s API + Airflow. Since the API doesn’t expose CSV exports yet, I settled on a quick Bash script to streamline manual updates:
#!/usr/bin/env bash
cd ..
source venv/bin/activate
cd boto3
python3 make_plot.py
Now the workflow is: export CSV from Notion, run the script, and the dashboard refreshes automatically. Simple, effective, and lightweight.