While setting up Kubernetes on my workstation, I took a closer look at how the components communicate and which ports need to be open. When everything runs on managed services it’s easy to overlook these details.
Ports Used by Kubernetes
The official documentation provides a handy summary.
Control Plane
| Protocol | Direction | Port(s) | Purpose | Used by |
|---|---|---|---|---|
| TCP | Inbound | 6443 | Kubernetes API server | Everyone |
| TCP | Inbound | 2379-2380 | etcd client API | kube-apiserver, etcd |
| TCP | Inbound | 10250 | Kubelet API (control plane) | Self, control plane |
| TCP | Inbound | 10259 | kube-scheduler | Self |
| TCP | Inbound | 10257 | kube-controller-manager | Self |
Worker Nodes
| Protocol | Direction | Port(s) | Purpose | Used by |
|---|---|---|---|---|
| TCP | Inbound | 10250 | Kubelet API | Self, control plane |
| TCP | Inbound | 30000-32767 | NodePort services | All clients |
The diagram from the docs helps visualize the components:

Every component talks to the API server over port 6443. etcd, the scheduler, controller manager, and kubelet expose their own ports. Worker nodes talk to the control plane via the kubelet on 10250, and services published as NodePorts use the 30000–32767 range.
Fun fact: the control plane also runs a kubelet.
How Does GKE Handle This?
I was curious which firewall rules Google configures for GKE.
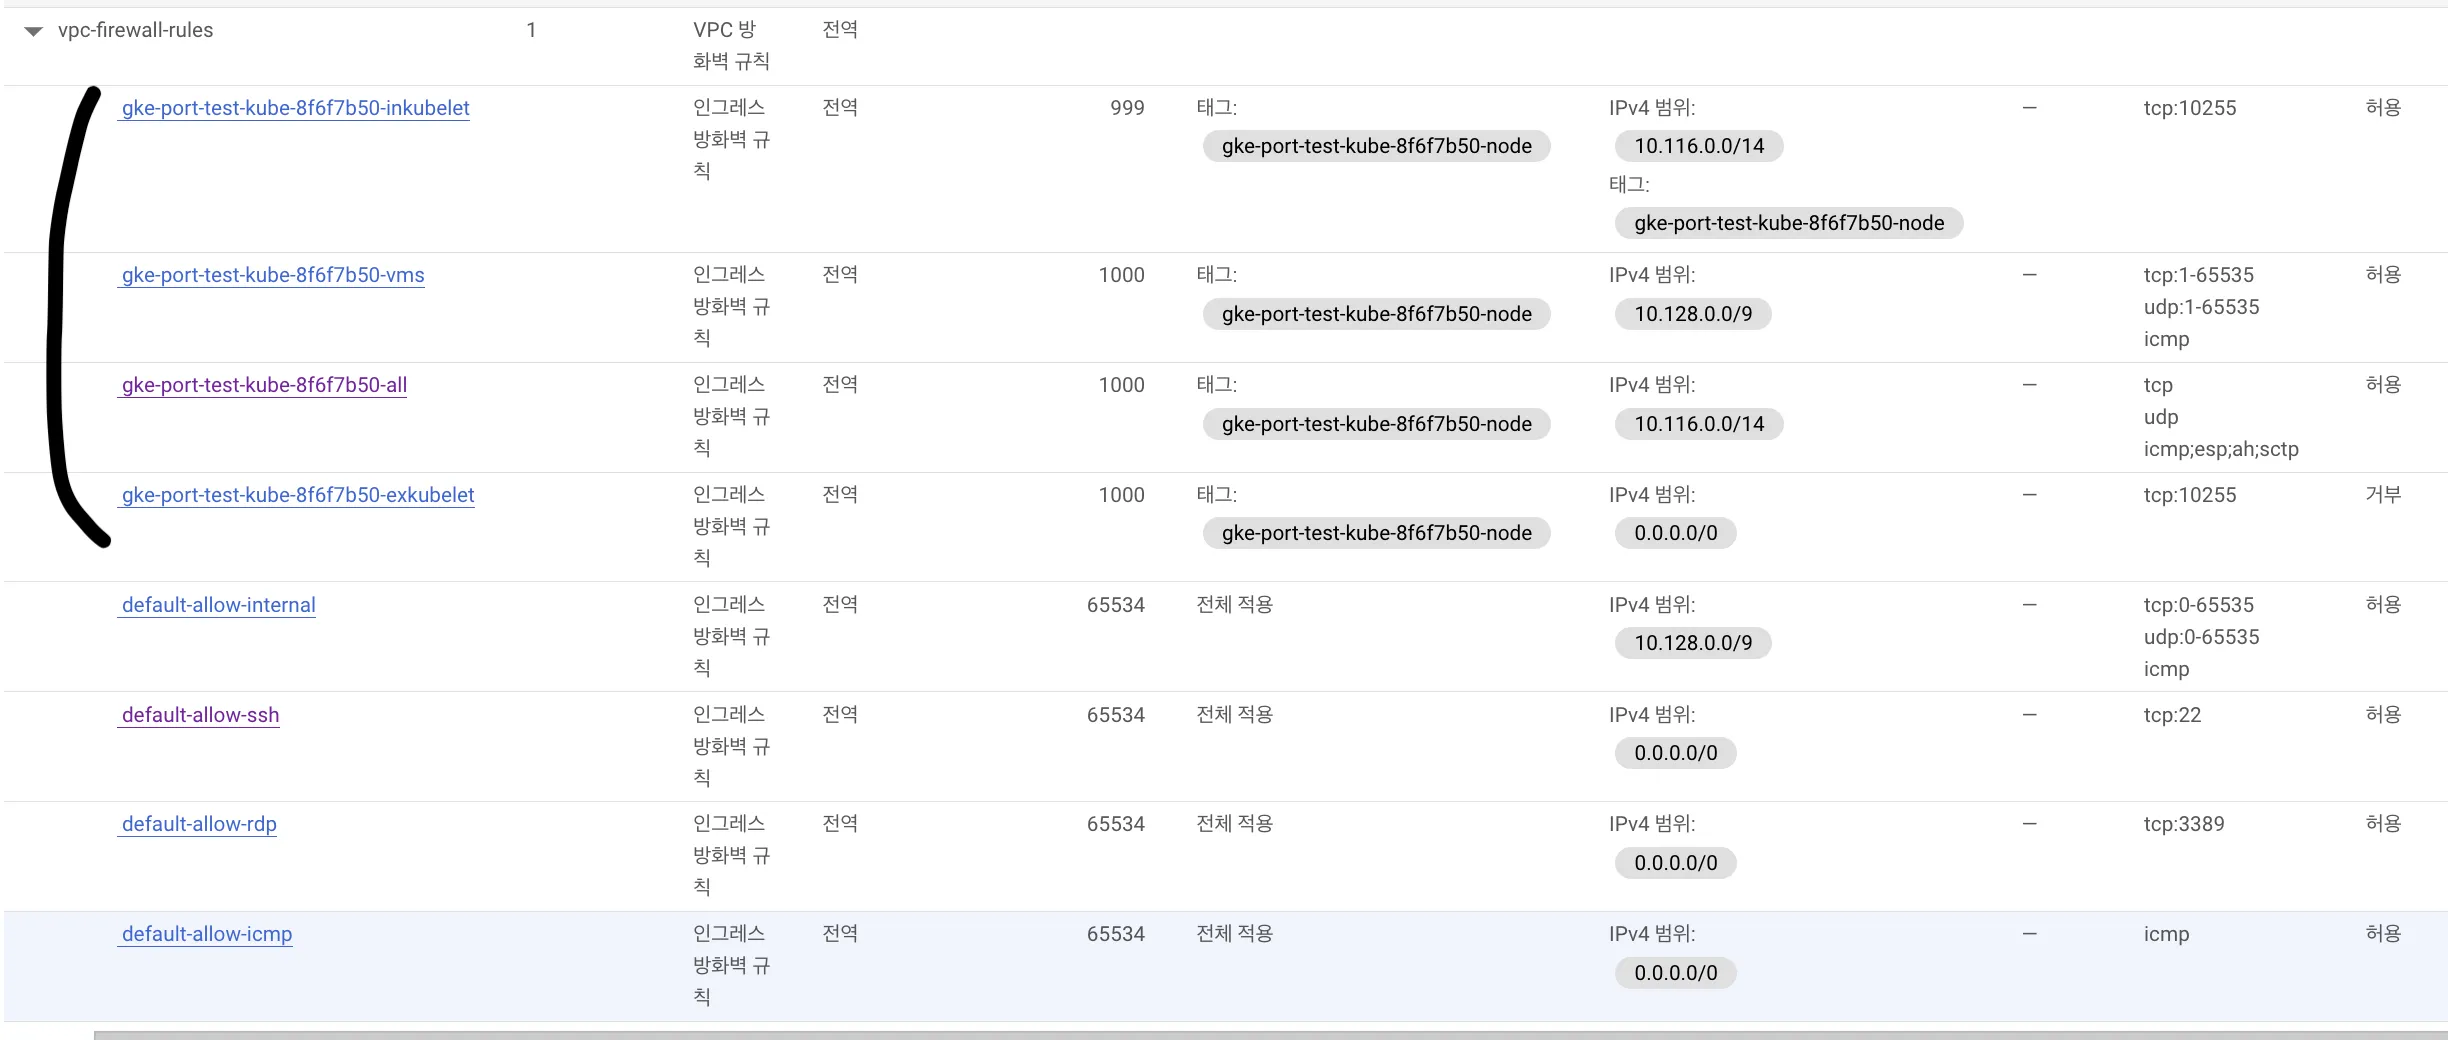
When a cluster is created, GKE provisions VPC firewall rules automatically:
10.116.0.0/14: default Pod CIDR10.128.0.0/9: control plane and node IP range
Both ranges allow all inbound traffic, which obviously covers the required ports. There’s also a rule for port 10255 (read-only kubelet API)—I need to dig deeper into where GKE uses it.
Interestingly, deleting all those firewall rules doesn’t break the cluster. That’s because GKE manages connectivity internally anyway, so the defaults are more of a template than a hard requirement.
Looking at a node definition reveals the kubelet endpoint:
daemonEndpoints:
  kubeletEndpoint:
    Port: 10250
And the metrics-server endpoint shows 10250 as well:
$ kubectl get endpoints -n kube-system metrics-server
NAME             ENDPOINTS          AGE
metrics-server   10.32.0.5:10250    8m29s
GKE hides the control plane, so we cannot inspect its pods directly. We can, however, view other components such as Calico by narrowing the field selectors:
$ kubectl get endpoints -n kube-system calico-typha
NAME           ENDPOINTS                           AGE
calico-typha   10.178.0.21:5473,10.178.0.22:5473   2m21s
The kubernetes service itself exposes 443, indicating the API server expects HTTPS (some clients speak gRPC under the hood):
$ kubectl get endpoints kubernetes
NAME         ENDPOINTS         AGE
kubernetes   10.178.0.20:443   38m
Bottom line: in GKE, the automatically generated VPC firewalls open everything between the control plane and nodes. For tighter security, keep 6443 open for the control plane, 10250 for kubelet traffic, the ports your workloads expose, and layer NetworkPolicies on top.
Additional Experiments
To double-check, I built a Kubernetes cluster on EC2 using containerd and kubeadm:
root@k8s-control-plane:~# kubectl get endpoints
NAME         ENDPOINTS           AGE
kubernetes   172.31.177.8:6443   5m19s
The system pods confirm which ports they rely on:
root@k8s-control-plane:~# kubectl get pods -n kube-system
NAME                                        READY   STATUS    RESTARTS   AGE
coredns-787d4945fb-6c8fb                    1/1     Running   0          8m
coredns-787d4945fb-hmf5f                    1/1     Running   0          8m
etcd-k8s-control-plane                      1/1     Running   0          8m14s
kube-apiserver-k8s-control-plane            1/1     Running   0          8m12s
kube-controller-manager-k8s-control-plane   1/1     Running   0          8m12s
kube-proxy-ddxrj                            1/1     Running   0          8m
kube-proxy-n55x5                            1/1     Running   0          3m41s
kube-scheduler-k8s-control-plane            1/1     Running   0          8m12s
Peeking at the manifests shows the liveness probes and ports:
# etcd
livenessProbe:
  failureThreshold: 8
  httpGet:
    host: 127.0.0.1
    path: /health?exclude=NOSPACE&serializable=true
    port: 2381
    scheme: HTTP
# apiserver
livenessProbe:
failureThreshold: 8
httpGet:
host: 172.31.177.8
path: /livez
port: 6443
scheme: HTTPS# controller-manager
livenessProbe:
failureThreshold: 8
httpGet:
host: 127.0.0.1
path: /healthz
port: 10257
scheme: HTTPS# scheduler
livenessProbe:
failureThreshold: 8
httpGet:
host: 127.0.0.1
path: /healthz
port: 10259
scheme: HTTPSEverything lines up with the docs. For a locked-down environment, open 6443 on the control plane, 10250 on worker nodes, and whatever ports your workloads expose.
Takeaway
Building clusters manually strengthened my understanding of how the pieces fit together—and reminded me why managed services are so convenient.